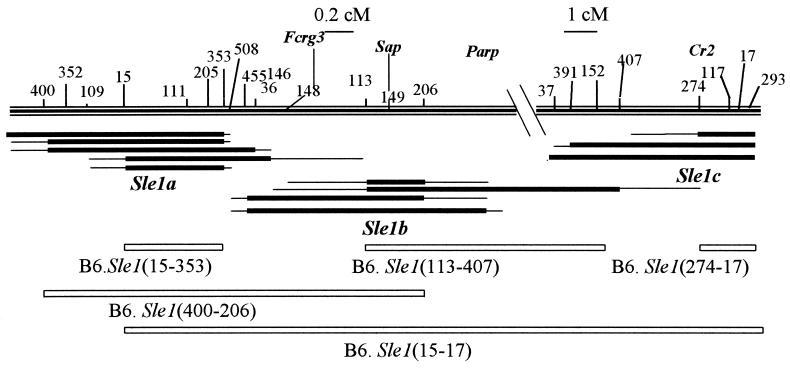
Figure 1.
Genetic map of the B6. Sle1 recombinants that were positive for anti-chromatin Ab production, defining the three Sle1a, Sle1b, and Sle1c loci. The top of the figure shows chr 1 telomeric of D1Mit400, the microsatellite markers used to map the recombinants (such as 400 indicates the position of D1Mit400), and the position of relevant genes. Immediately under this map are shown the three clusters of recombinants that were anti-chromatin Ab positive. For each recombinant, the thick line indicates the NZM2410 interval, flanked by two thin lines showing the area of recombination between the NZM2410 and B6 genomes. Finally, the white rectangles show the homozygous intervals corresponding to the subcongenic strains produced for functional studies. Note the different scale for the Sle1a + b and Sle1c regions [0.2 centimorgan (cM) and 1 cM, respectively]. B6.Sle1(47–105), not represented on this figure, corresponds to the 7-cM interval located between D1Mit47 and D1Mit400.

