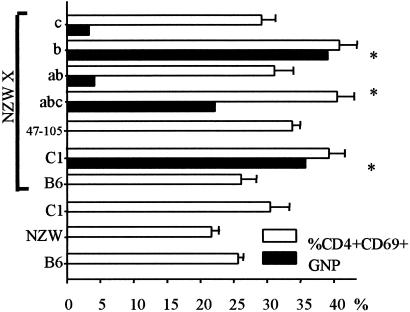
Figure 3.
Nephrogenicity associated with the Sle1 loci on an NZW hemizygous background. Black bars indicate the penetrance of proliferative GN (GNP) associated with each strain combination. White bars indicate the corresponding percentage of CD4+ CD69+ lymphocytes at sacrifice (mean +SE, 20–25 mice per group). The asterisks indicate the strain combinations that showed a significant amount of GNP, which are also those with the highest CD69 expression in CD4+ cells.

