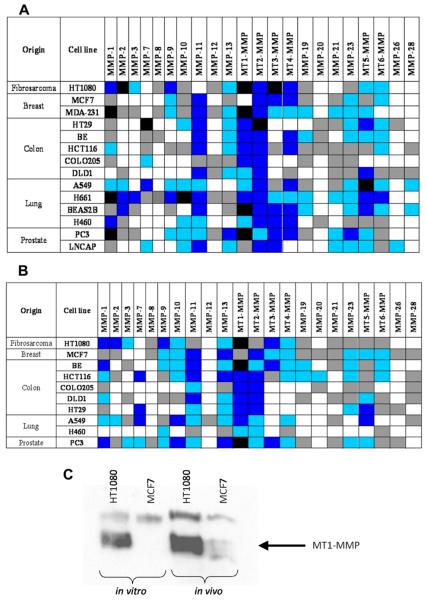
Figure 1.
MT-MMPs are elevated in human preclinical tumor models. Expression of MMP mRNA in human cell lines grown in vitro (A) and as xenografts in vivo (B) as measured by quantitative RT-PCR. Expression values after normalization to 18S-rRNA and are gene specific. Classification of expression levels was determined from the CT of each gene as either very high (CT ≤ 25), high (CT = 26-30), moderate (CT = 31-35), low (CT = 36-39), or not detected (CT = 40); see key for color scheme. (C) Immunoblot of MT1-MMP protein expression in HT1080 and MCF7 tumor models.
Key for qRT-PCR expression: 

