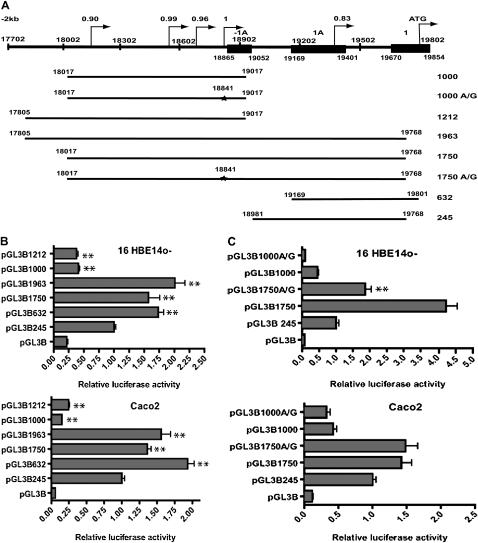
Figure 3.
CFTR promoter analysis. (A) Diagram of the 5′ region of the human CFTR gene (to scale). The alternative exons, −1a and 1a, and exon 1 are shown (filled boxes). Putative promoters, with their predicted scores, are shown by arrows. Numbering refers to AC000111. At the bottom are shown each of the constructs used in reporter gene assays, with the name denoting the length of promoter fragment. The star denotes the A/G mutation that disrupts the putative promoter with a score of 1. (B and C) Luciferase reporter gene assays with CFTR promoter fragment constructs. Each bar chart shows the luciferase activities for each construct relative to pGL3B245 (CFTR basal promoter construct = 1) in B, 16HBE14o− and Caco2 cells. (B and C) Luciferase activities were normalized for transfection efficiency by cotransfection with pCMV/β-galactosidase. Each bar is the average of at least three transfection experiments, with each sample assayed in triplicate. Error bars represent SD. (B) Stars indicate statistical significance of a comparison between pGL3B245 values and those of the other construct (**P < 0.01). (C) The effect of the 18,841 A/G mutation in the 1,750 construct on promoter activity in 16HBE14o− and Caco2 cells. Stars indicate statistical significance of the pGL3B1750 to pGL3B1750 A/G comparison in 16HBE14o− cells (P < 0.01).

