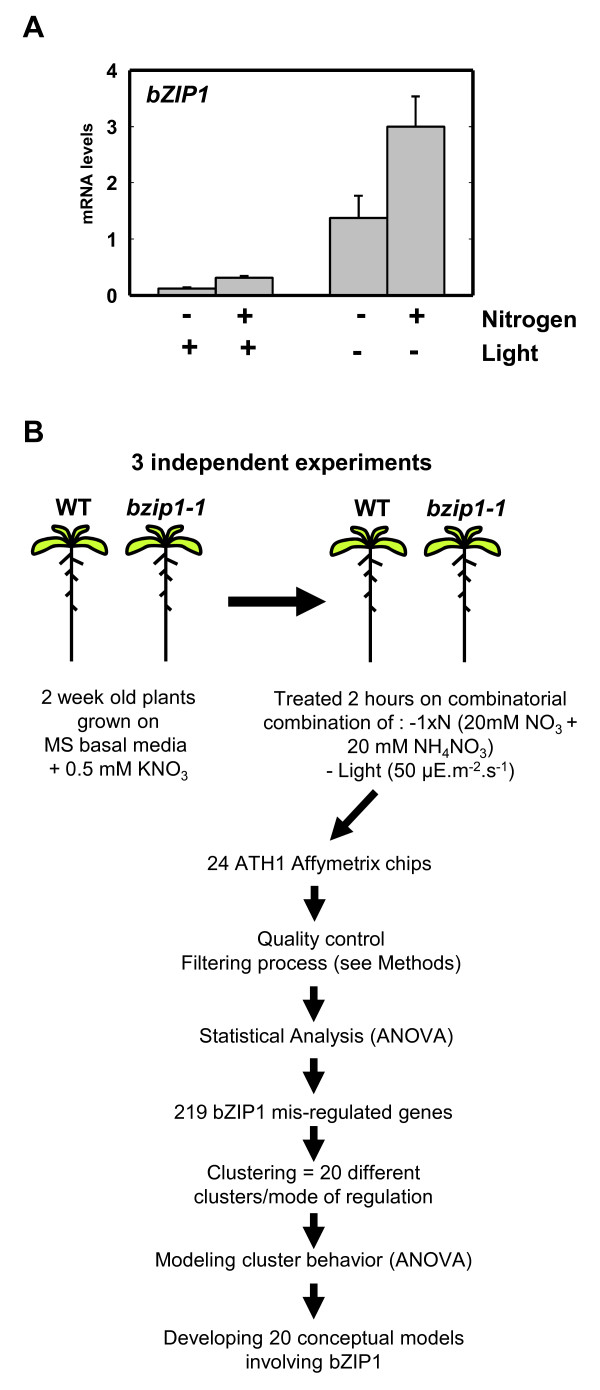
Figure 1.
Experimental design for systematic analysis of N and/or L-regulation via bZIP1. (A) Quantification of bZIP1 mRNA levels in Col-0 plants. Transcript levels are determined by real-time PCR and are shown as relative to expression of Clathrin gene. Values are the mean ± SE from three biological replicates. (B) Schematic diagram of the data mining approach used in this study. Briefly, WT siblings and bzip1-1 T-DNA mutant plants are treated with combinatorial conditions varying light and nitrogen. Genome-wide analysis using ATH1 Affymetrix chips has been used in order to quantify mRNA levels. Modeling of microarray data, using ANOVA/clustering procedure (detailed in Methods), enables the identification of genes for which bZIP1 is involved in mediating the effects of N and/or L signal integration.

