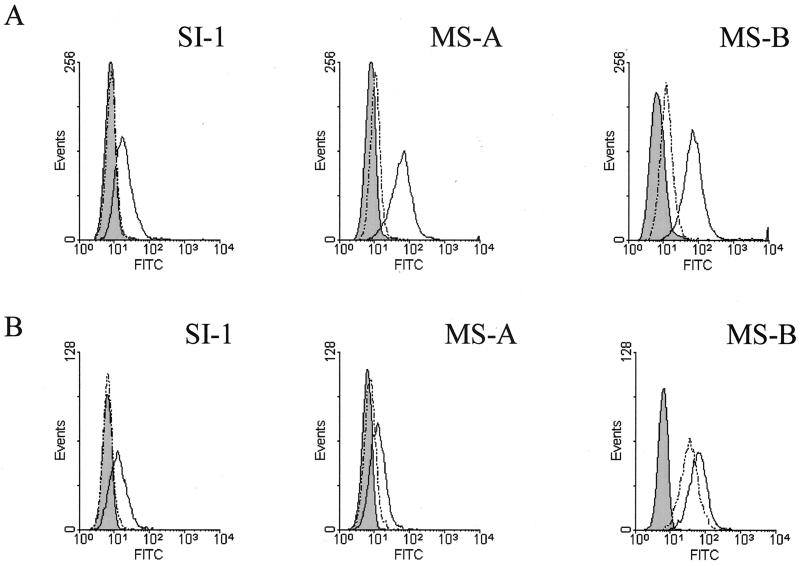
Figure 3.
Reactivity of mAbs MS-A, MS-B, and SI-1 with the surface of rat neuroblastoma (ND-7) (A) and human oligodendrocyte cells (B). Antibody binding to cell populations before and after DNaseI treatment is represented by a solid line (unshaded) and dotted line (unshaded), respectively. Background fluorescence (shaded) was determined in the absence of primary antibody and was in each case equivalent to the fluorescence signal generated when the cells were incubated with mAb KZ52, which is specific for Ebola virus.

