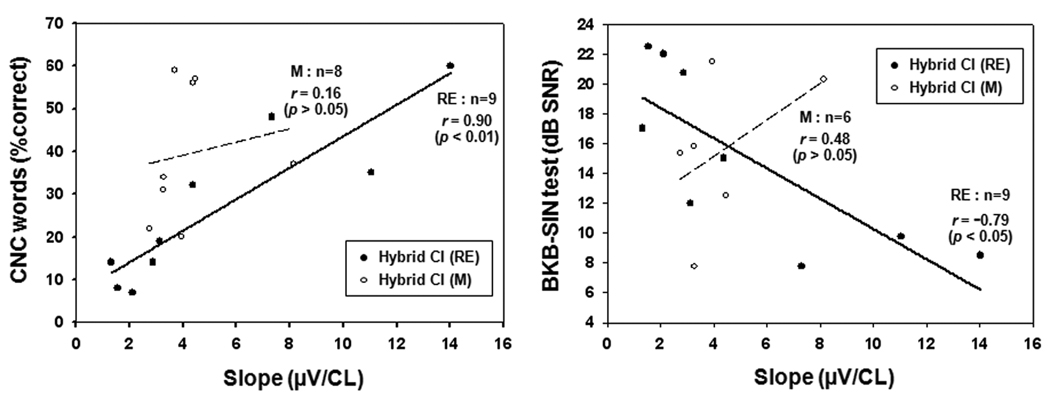
Figure 3.
The relationship between the slopes of the ECAP amplitude intensity functions and the speech perception scores is shown for subjects with Hybrid RE and M CI. Left and right columns show correlations between slope of growth function and speech understanding in quiet (CNC words), and noise (BKB-SIN test), respectively. Open circles represent Hybrid M, and filled circles indicate Hybrid RE. Only Hybrid RE CI recipients show a significant correlation between the slope of the ECAP growth function and speech performance_(Left column : r=0.90, p<0.01 ; Right column : r=−0.79, p<0.05).

