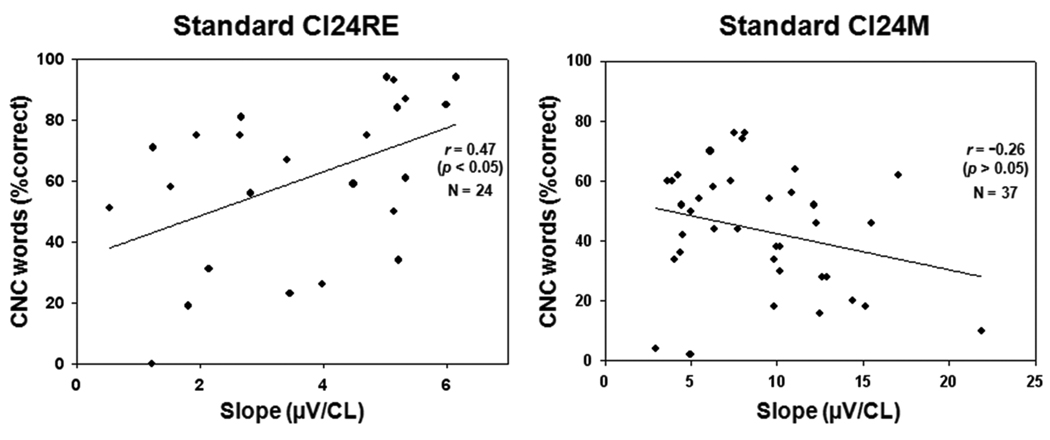
Figure 5.
The relationship between the slope of the growth function and performance is shown for CI24M and CI24RE CI recipients. The left column plots the CNC word scores as a function of the slopes of the ECAP growth functions for 24 ears with CI24RE implants. The right column plots data from 37 CI24M CI recipients (Brown et al., 1999). In contrast to CI24M users, CI24RE recipients show a significant correlation between the slope of the ECAP growth function and CNC word scores (r=0.47, p<0.05).

