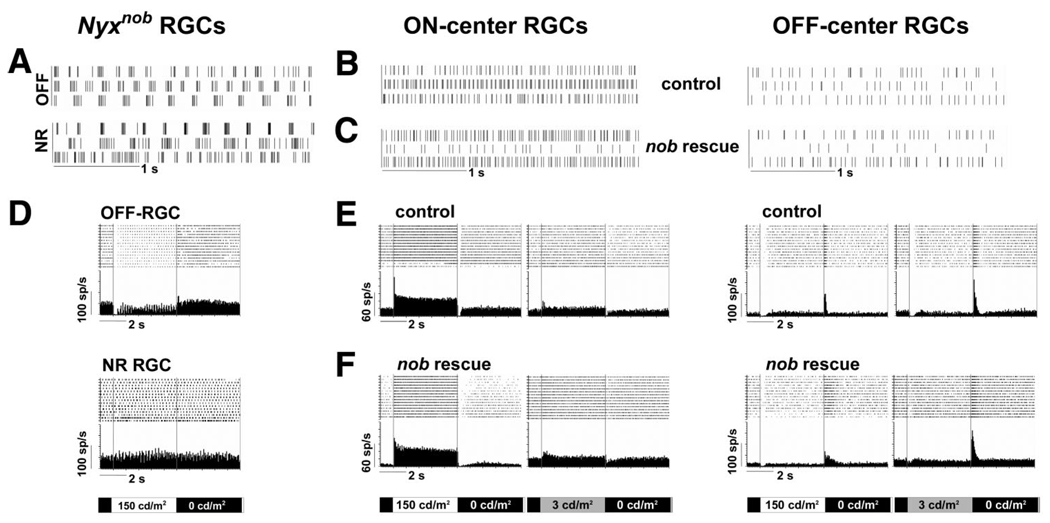
FIG. 6.
Spontaneous and light evoked responses of nob rescue retinal ganglion cells (RGCs) are identical to controls. A–C: raster plots of spontaneous activity in representative nob, control, and nob rescue RGCs under dark-adapted condition (0 cd/m2). Each trace represents a different cell and shows that the bursting pattern is only present in nob RGCs. The lower spontaneous activity in off-center cells also is apparent in control and nob rescue mice. D: raster plots and PSTHs of 2 representative nob RGCs, 1 an off cell, and the 2nd that is not responsive to light stimuli. E and F: raster plots and average PSTHs of the evoked activity for representative on- and off-center RGCs in control and nob rescue mice under both light (left; 0 to 150 cd/m2) and dark (right; 0 to 3 cd/m2) adapted conditions.

