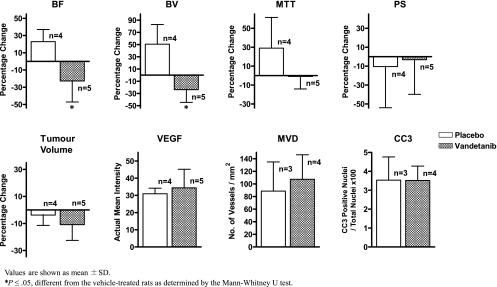
Figure 1.
Bar graph plots of data from nonhypovascular tumors shown in Table 2. The numbers of animals treated with vehicle (open bar) and vandetanib (hatched bar) are shown. Values are shown as mean ± SD. *P ≤ .05, different from the vehicle-treated rats as determined by the Mann-Whitney U test.

