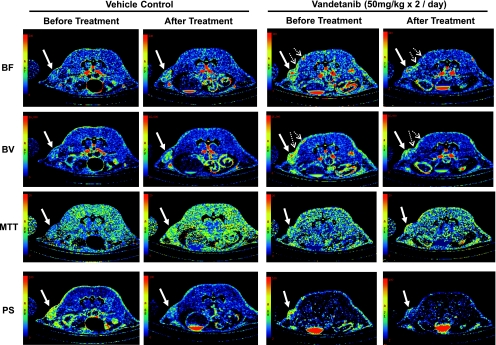
Figure 2.
Representative BF, BV, MTT, and PS maps of a transaxial section through the tumor of one vehicle- and one vandetanib-treated nonhypovascular tumor before and after treatment. In the BF, BV, MTT, and PS maps, values from 0 to 240 ml/min per 100 g, from 0 to 16 ml/100 g, from 0 to 20 seconds, and from 0 to 100 ml/min per 100 g, respectively, are coded according to the rainbow color scale. The parametric maps, in particular BF and BV maps, show the level of angiogenic activities in the tumor and adjacent tissue as indicated by solid and dotted arrows respectively.

