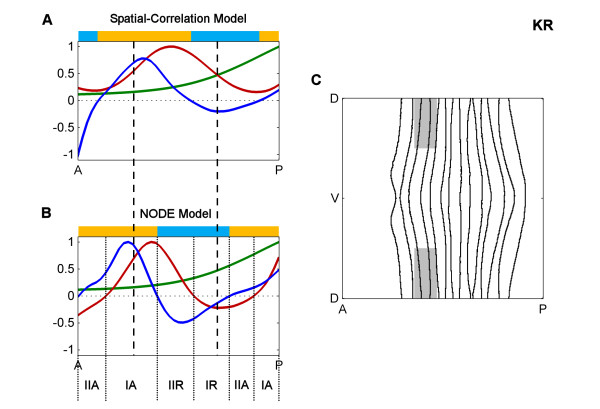
Figure 7.
Comparison of spatial correlation and NODE models for KR at Stage 5:9-25. A. The spatial correlation model along part of the anterior-posterior (AP) axis. B. The NODE model along part of the AP axis. C. The portion of the embryo which is plotted in A and B. The figure is labeled using the same conventions as Figure 5 except that the protein expression and models are for KR protein.

