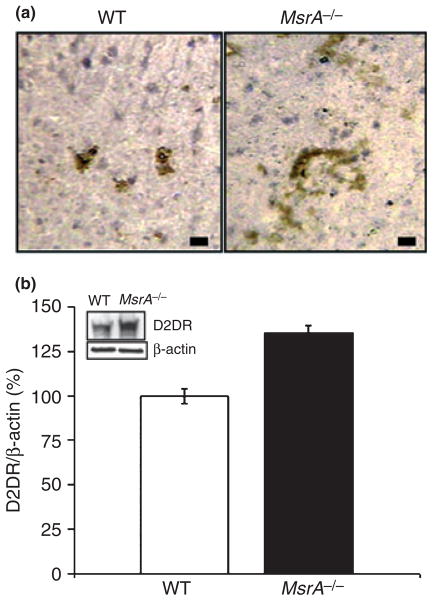
Fig. 1.
Immunohistochemistry and immunoblot analyses of D2DR in MsrA−/− and WT striatum. (a) Immunohistochemistry of coronal brain sections using primary antibodies against D2DR. Slides were visualized using light microscope with a 100× objective lens. Brownish structures correspond to the presence of D2DR. Scale bars represent 10 μm. (b) Immunoblot analysis using primary antibodies against D2DR. Representative bands are shown in the small window followed by densitometry analysis for the corresponding D2DR band in each extract (relative density in WT represents 100%; p < 0.01, t-test). The densities of D2DR were corrected for the relative densities of β-actin.

