
Figure 5.
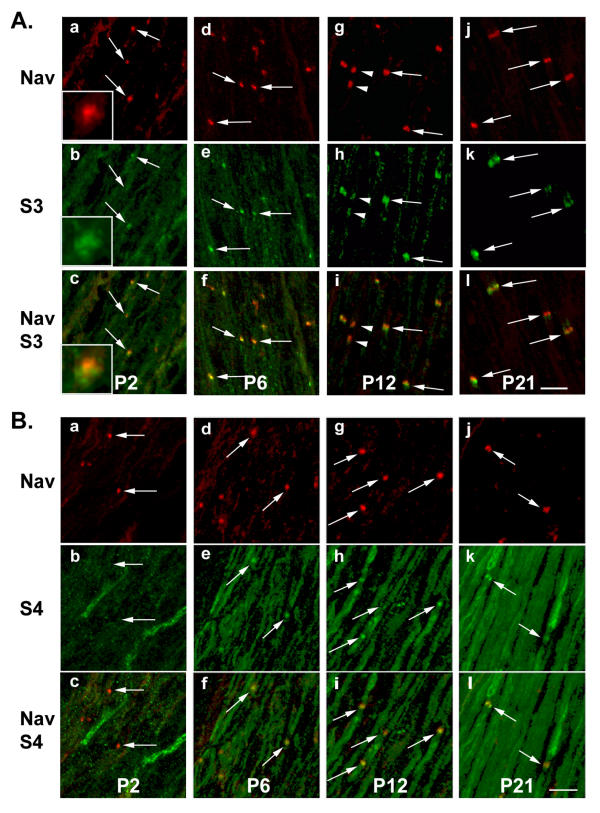
Developmental profile of S3 and S4 in rat sciatic nerve. Sections through rat sciatic nerve at P2, P6, P12, and P21 were labeled with antibodies to S3 (A, green) or S4 (B, green) and Na+ channels (Nav, A, B, red). Superposition of the two labels is indicated by arrows. At P2, S3 and Nav labelings appear to be in very close contact with each other (A.a-c, insets). For S3, a pair of heminodes is indicated by arrowheads (A.g-I). A, B: confocal stacks. Scale bars: 10 μm.