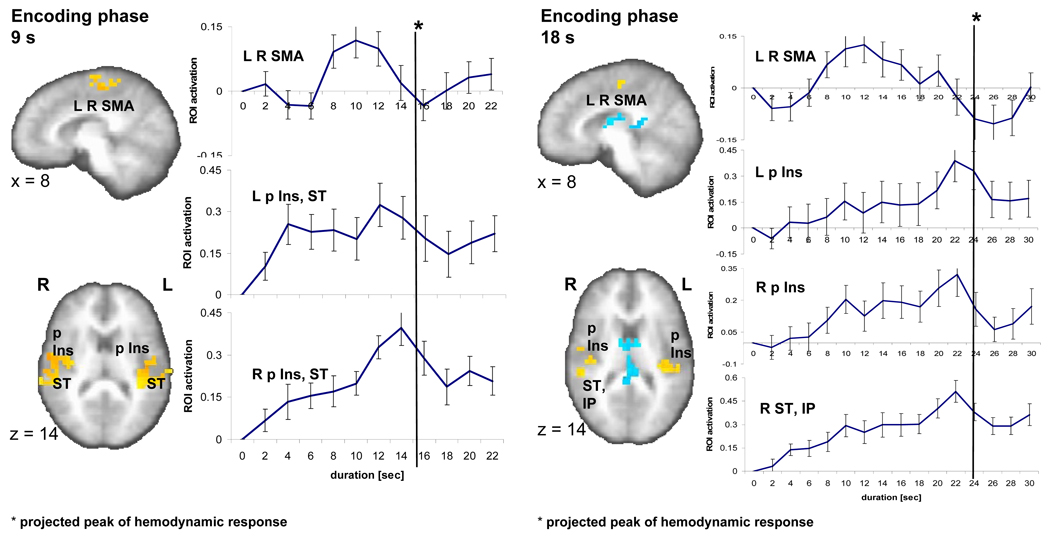
Fig. 2.
Brain activity during the 9-s (left) and 18-s (right) encoding phase. A sagittal (x=8) and an axial slice (z=14) show significant brain activity (p < 0.01, corrected) in three regions encompassing a bilateral medial frontal area (SMA), left and right posterior insula (p Ins) as well as superior temporal cortex (ST) as related to the encoding versus control contrast in the 9-s and 18-s conditions. Individual time activity curves (set to zero at the onset of the stimulus) show an inverted u-shape function in the SMA and climbing brain activity that peaks at the end of the stimulus (with a delay of ca. 6 seconds reflecting the hemodynamic response function) for left (L) and right (R) p Ins, ST.

