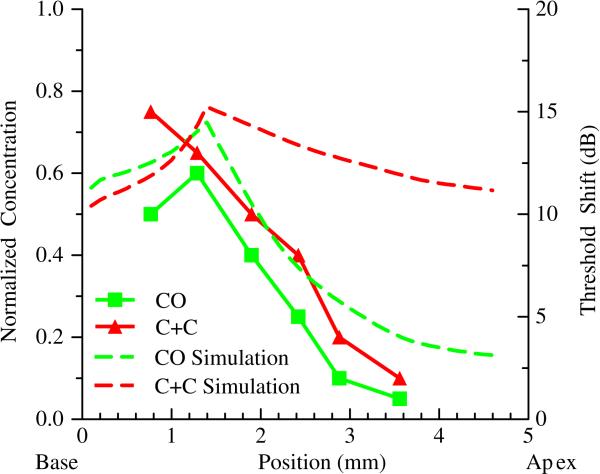
Figure 5.
Comparison of simulated concentration gradients to measured DPOAE threshold shifts. Simulated infusion is at 1.3mm. Dotted lines represent normalized drug concentrations in scala tympani following 65 minutes of simulated infusion at 16 nl/min. Data points with solid lines represent in vivo threshold shifts following infusion of 1000nl of SAL. The scale for threshold shift was adjusted to facilitate comparison of trends in threshold and concentration data, and does not suggest a direct correlation between the datasets. The CO data sets are qualitatively similar while the C+C threshold shifts fail to follow the shape of the predicted concentration gradient.

