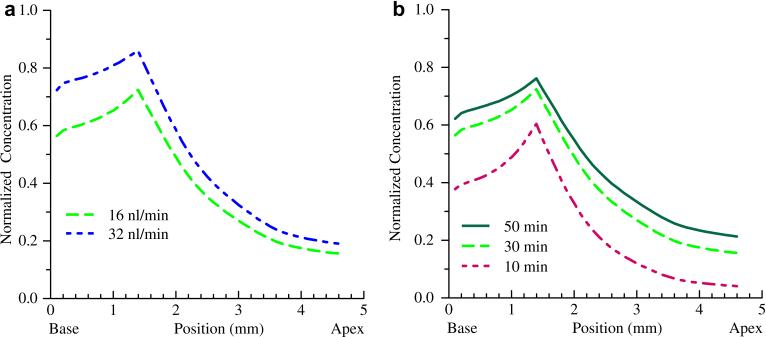
Figure 7.
Simulated concentration gradients for the CO infusion at different flow rates and clearance rates. (a) Doubling the flow rate to 32nl / min (blue) results in a predicted increase in concentration consistent with the physiological experiments. (b) Clearance rates have a significant impact on predicted concentrations as shown by the interscala and scala-to-blood communication half-times of 10, 30 and 50 minutes.

