
Fig. 1.
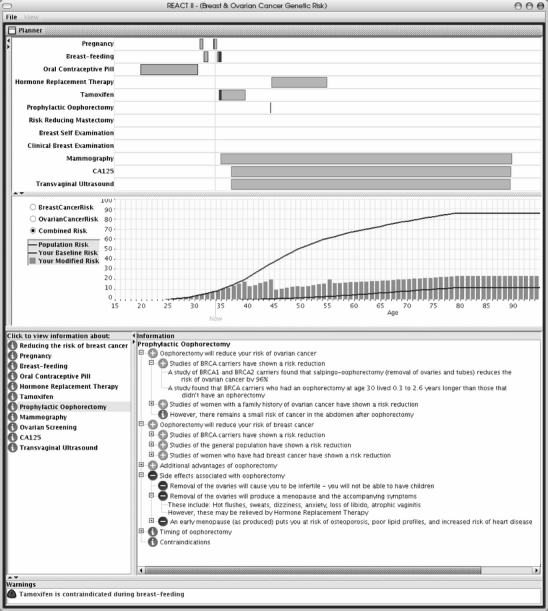
The REACT user interface. A plan is being developed for risk mitigation by manipulating actions in the planning chart (top). The outcome measure graph (middle) indicates the estimated risk of breast cancer, while arguments for and against prophylactic oophorectomy for this patient are reviewed in the information panel (bottom)