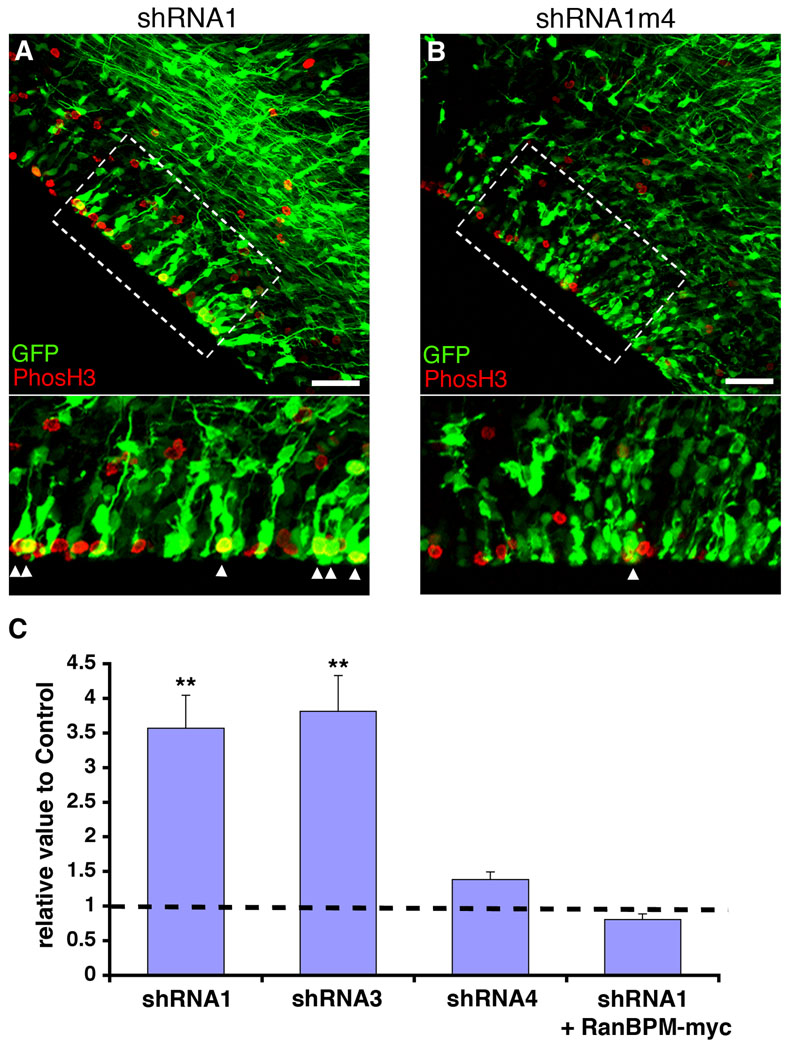
Figure 5. RNAi of RanBPM increases the number of cells in mitosis.
RanBPM-shRNA1 (shRNA1, A) and control shRNA1m4 (B) were co-transfected with GFP in E13 rat embryonic brains by in utero electroporation and analyzed with immunostaining 3 days after transfection. The boxed regions in the upper panels are shown at higher magnifications in the bottom panels (A and B). Note that larger numbers of both phosH3-positive and GFP-positive cells appear in RanBPM-shRNA1-transfected VZ than in control shRNA1m4-transfected VZ. Scale bars, 50 µm. C, The analysis of mitotic marker, phosH3, in RanBPM-shRNA1 and control shRNA1m4 treated VZ. Both phosH3-positive and GFP-positive cells at the VZ were counted and normalized to total GFP-positive cells at the VZ, and then normalized to control transfected condition (n=3 brains, 6 sections from each brain). The control value is shown as the black dotted line. Note that higher numbers of mitotic cells (phosH3+ GFP+/total GFP+ cells) are observed with shRNA1 and shRNA3 transfection than with shRNA4 transfection compared to control shRNA1m4 transfection. In contrast, by co-expression of RanBPM-myc with shRNA1 the number of mitotic cells was similar to that for cells transfected with GFP alone. **, p<0.01, determined by Student’s t-test. Error bars represent ± s.e.m.

