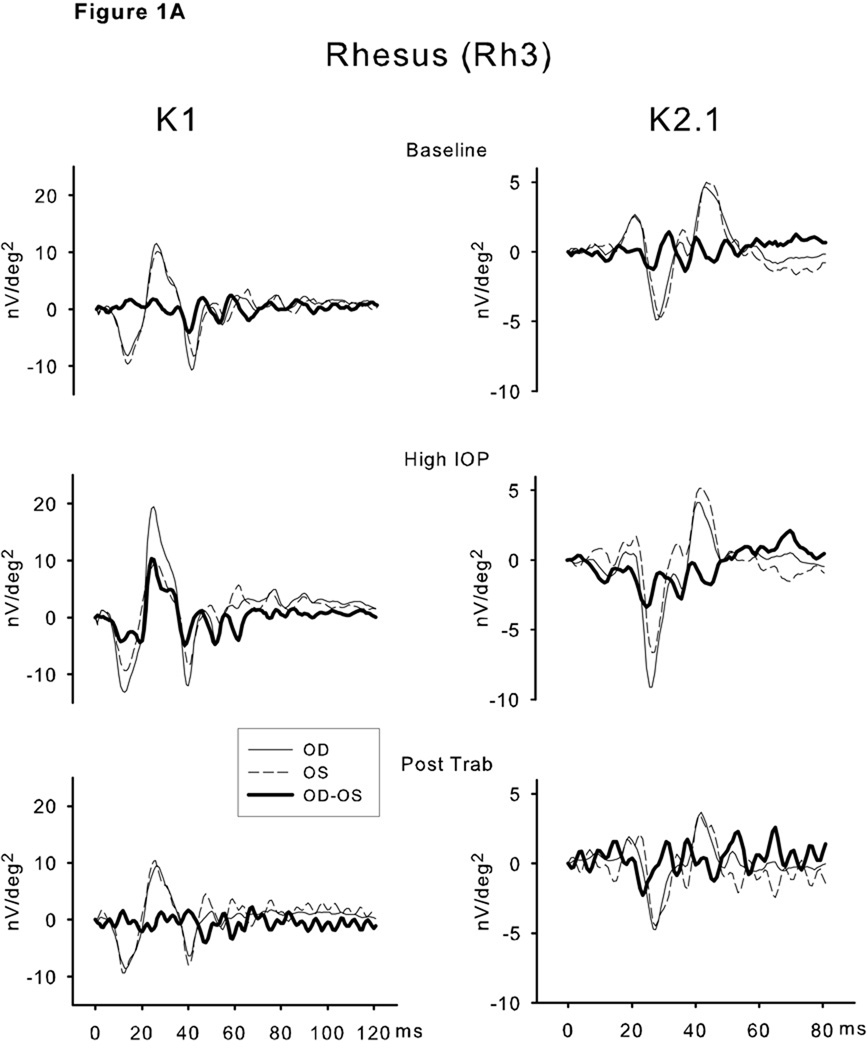
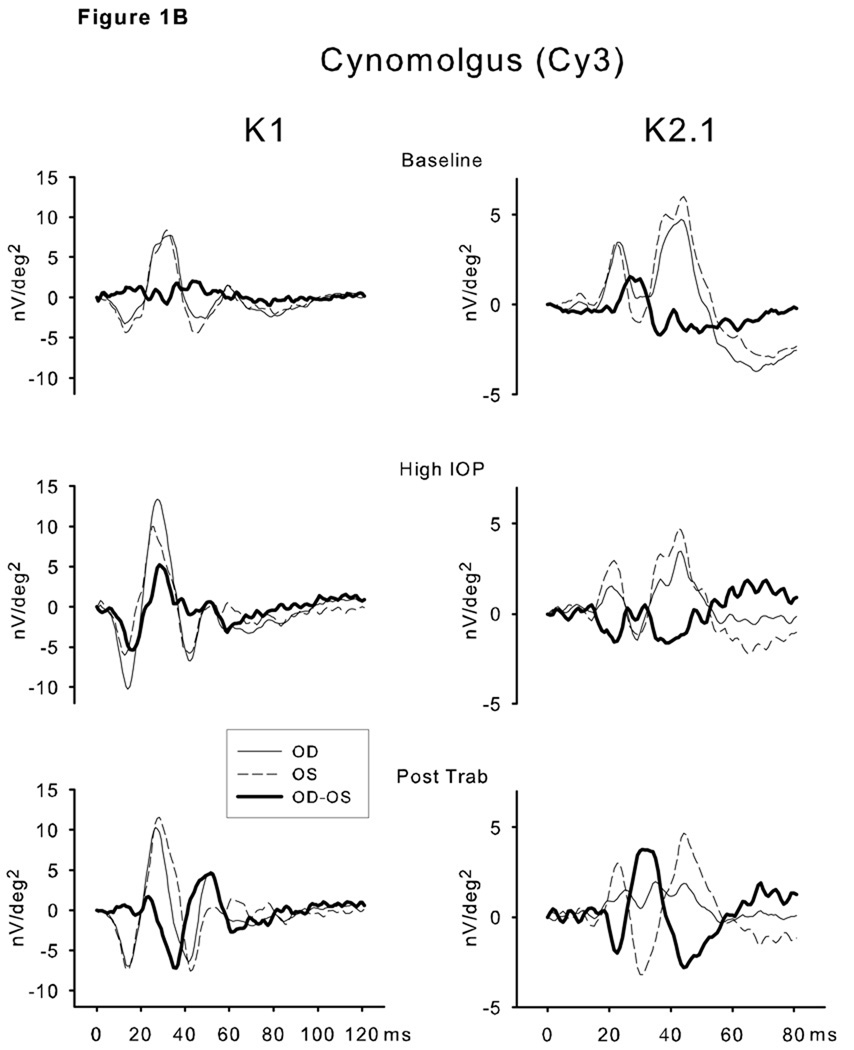
Figure 1.
Selected individual waveforms for the 2 recovery animals—Rh3 (A) and Cy3 (B). These are the unfiltered waveforms from single stimulus elements at or adjacent to the center (Ring 1) of the 103 element array. The waveforms for the right (solid line, high IOP) and left (dashed line, normal IOP) eyes as well as the difference (OD-OS, bold line) waveform are superimposed. Each right-left pair of traces was obtained on the same test day. The left column are the K1 waveforms and the right column the K2.1 waveforms. The upper plots are the baseline comparisons, the middle are during the epoch of elevated IOP and the lower are the waveforms post-trabeculectomy. See text for interpretation.


