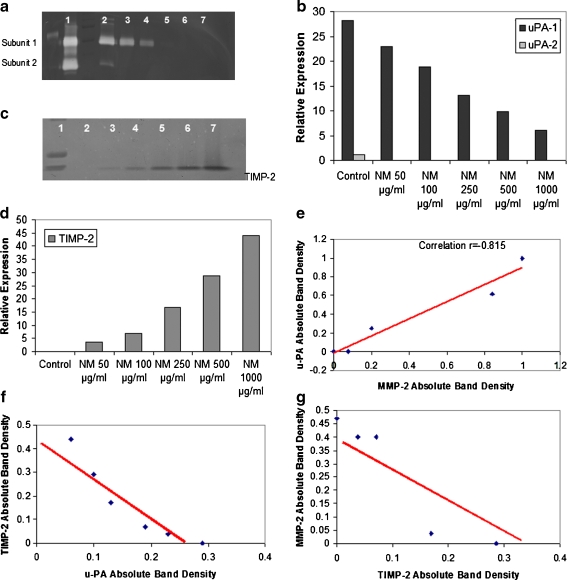
Fig. 9.
Effect of NM on prostate PC-3 cell u-PA secretion (a) and on TIMPs secretion (c). 1 Markers, 2 control, 3–7 NM 10, 50, 100, 500, 1,000 μg/ml. Densitometric analyses of PC-3 u-PA secretion (b) and TIMPs secretion (d). Correlation between: PC-3 u-PA and MMP-2 expression (e), PC-3 TIMP-2 and u-PA expression (f), PC-3 MMP-2 and TIMP-2 expression (g)

