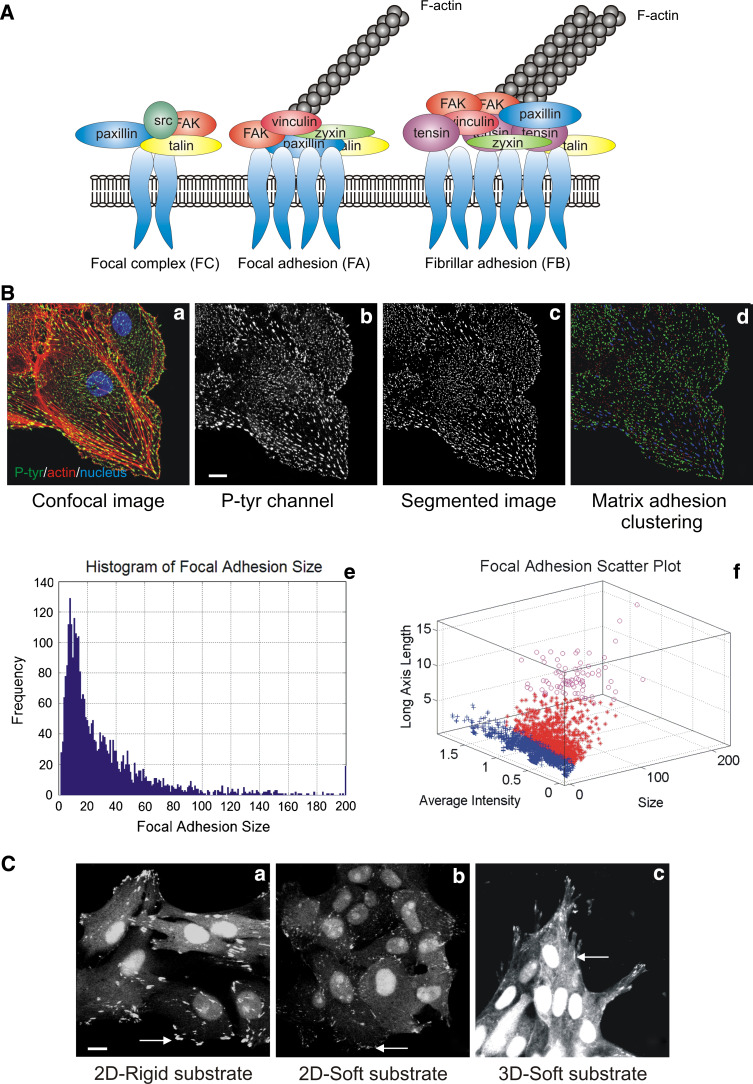
Fig. 1.
Matrix adhesions diversity and composition. a Schematic view of the three classes of matrix adhesions found in adherent cells in vitro. b Image analysis of matrix adhesions. Confocal picture of epithelial cell stained for Hoechst (blue), P-Tyr (green) and F-actin (red) (a); scale bar 10 μm. Confocal picture of focal adhesions only (b). Matrix adhesions segmentation (c) and clustering according to size (d). Distribution of the matrix adhesions according to their size (e) and clustering according to matrix adhesions intensity and length (f). c Matrix adhesions differ in size and shape according to their environment: in 2D rigid versus soft and in 3D; scale bar 10 μm

