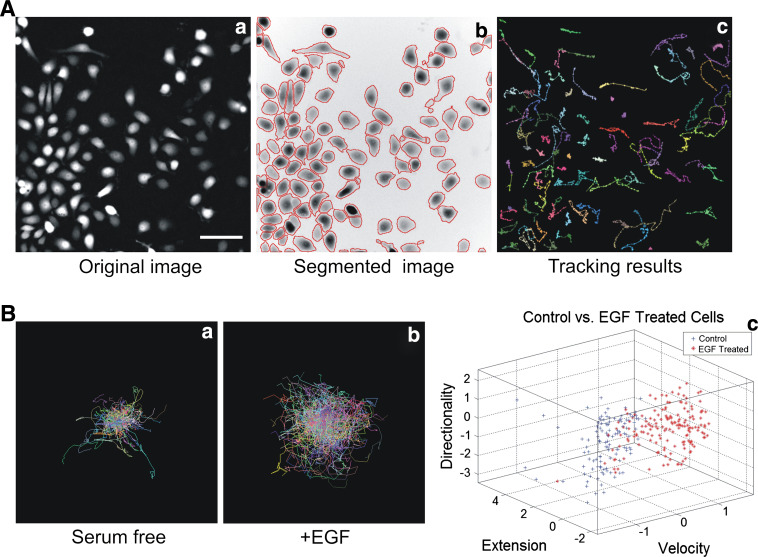
Fig. 2.
Imaging and analysis of single cell migration. a Epifluorescent imaging and analysis of migrating MTLn3 cells ectopically expressing GFP. Epifluorescent pictures (a) are waterline based segmented (b) and cells are consequently tracked (c); scale bar 50 μm. b Individual cell tracks of MTLn3 stimulated (a) or not by EGF (b) and clustering analysis of both treatments based on directionality, extension and velocity (c)

