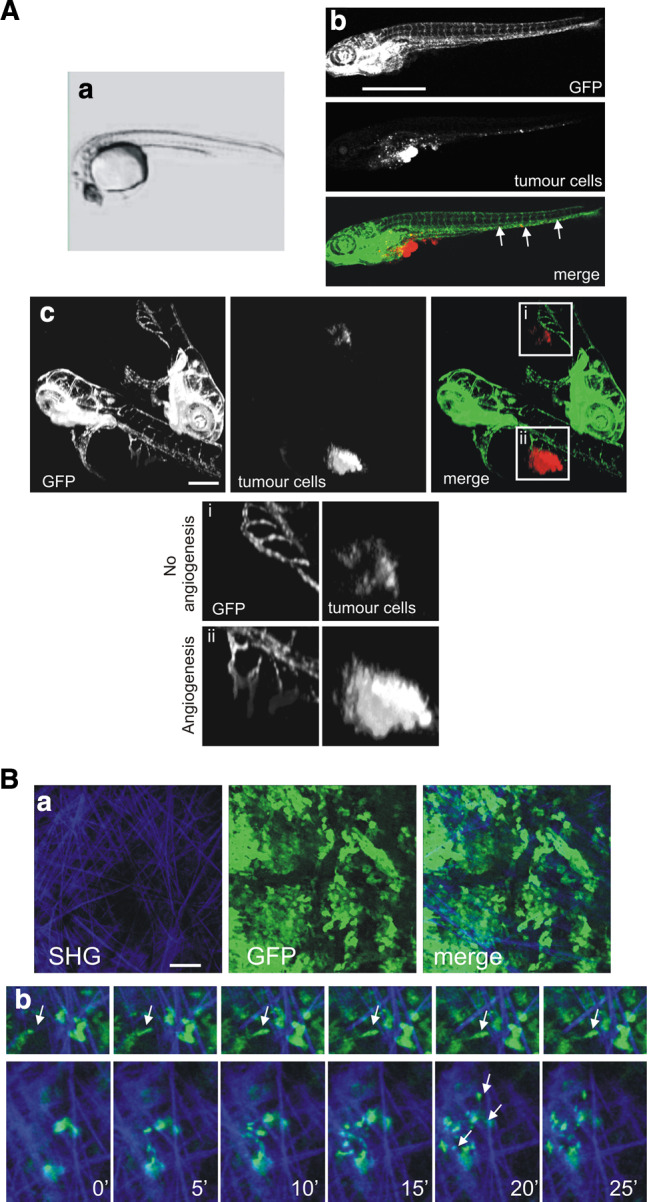
Fig. 6.

Imaging tumour cell migration in vivo. a Migration and cell mass formation of human tumour cells injected into the yolk sac of zebrafish embryos (Pictures obtained from V. Gothra, S. He, BE Snaar-Jagalska, and EHJ Danen). a Phase contrast overview picture of the yolk sac of zebrafish embryos. b An example of spreading of 4T1 breast tumour cells (red) in transgenic zebrafish embryos expressing GFP under an endothelial promotor. Cells invaded, migrated and formed distant micrometastases, which are indicated with arrows. Scale bar 1 mm. c Two examples of zebrafishes without angiogenesis (i) and with angiogenesis formed through the tumour cell mass formed (ii). Scale bar 200 μm. b Rat mammary carcinoma MTLn3 cells in orthotopic mammary tumours move show high motility in vivo with an amoeboid. a Multiphoton microscopy shows tumour mass (green) and extra cellular matrix visualised by second harmonic generation (blue). Scale bar 100 μm. b Time-lapse images of MTLn3 carcinoma cells as they extend protrusions along ECM fibres (arrowheads). Images shown are at 5-min intervals
