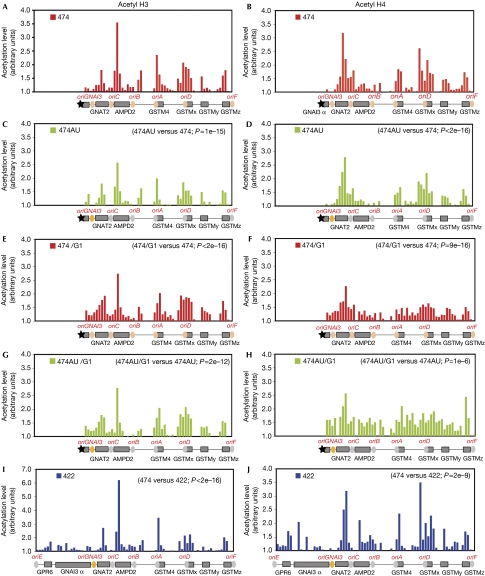
Figure 2.
Histone acetylation patterns in growing or G1-arrested cells correlate neither with localization nor with efficiency of origins. Chromatin immunoprecipitation experiments were performed with antibodies recognizing acetyl histone (A,C,E,G,I) H3 or (B,D,F,H,J) H4 and analysed by microarray hybridization. Results are expressed as the ratio of immunoprecipited DNA signal to the input signal (arbitrary units). Mean values of two experiments are reported. Circles symbolize: orange, major origin; grey, minor origin; tan, average efficiency. Black star: rearrangement breakpoint. Cells were compared for histone acetylation profiles by using the Spearman test. In all cases, the correlation between mean values was significant (P<0.05). Comparison and P-value results are indicated at the top right corner of each graph.

