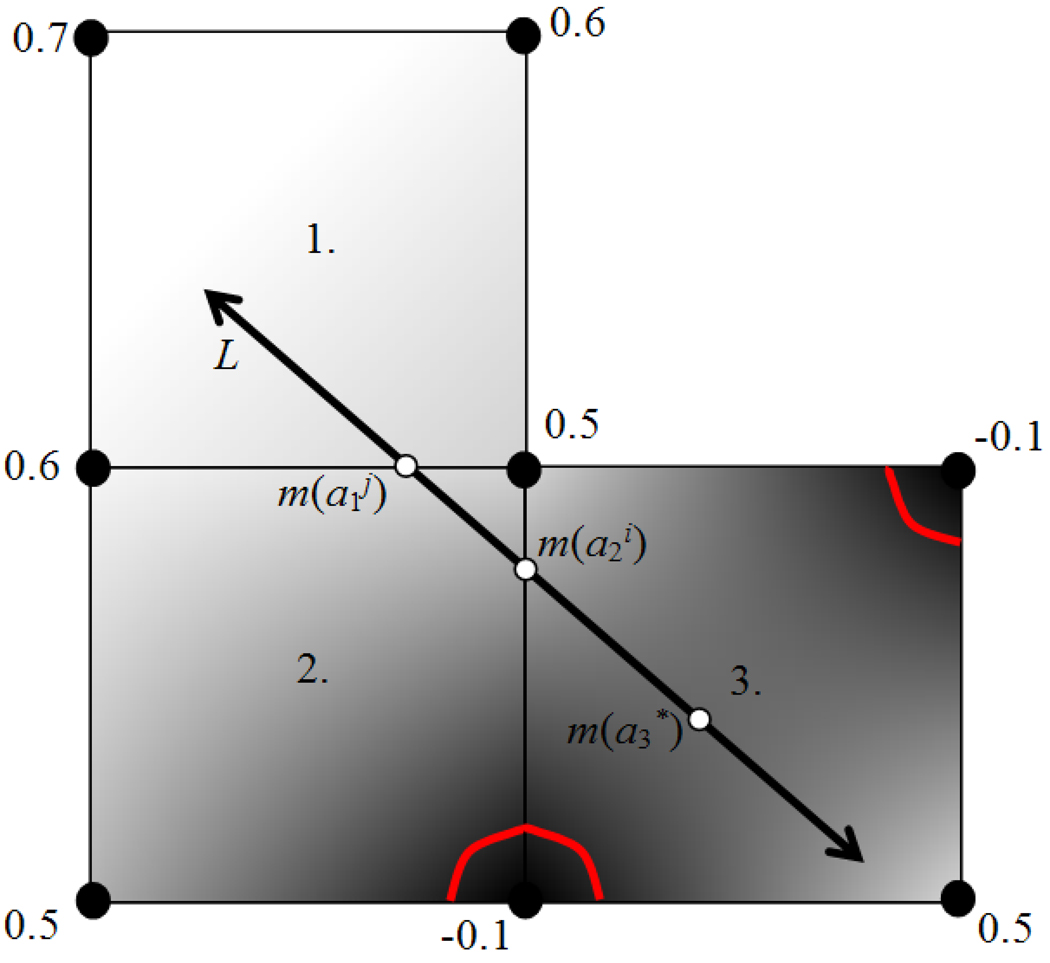
Figure 5.
2D example of the minimizer of a linear interpolant function along a line. The nodes denote pixel positions in the distance map, each with an assigned distance value. The gray level intensities illustrate the relative interpolated distance values between the known pixel values. The red contours indicate the position of the surface implied by the distance values. The minimizers along L of the interpolation function for three 4-pixel neighborhoods through which L passes (labeled 1, 2, and 3) are displayed, labeled as a1, a2, and a3.

