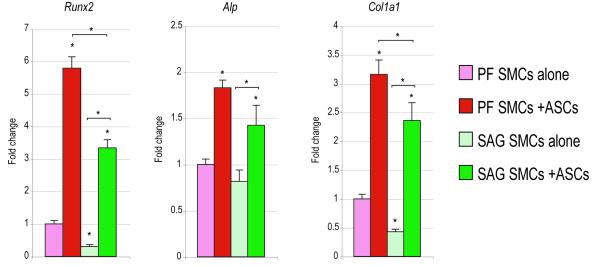
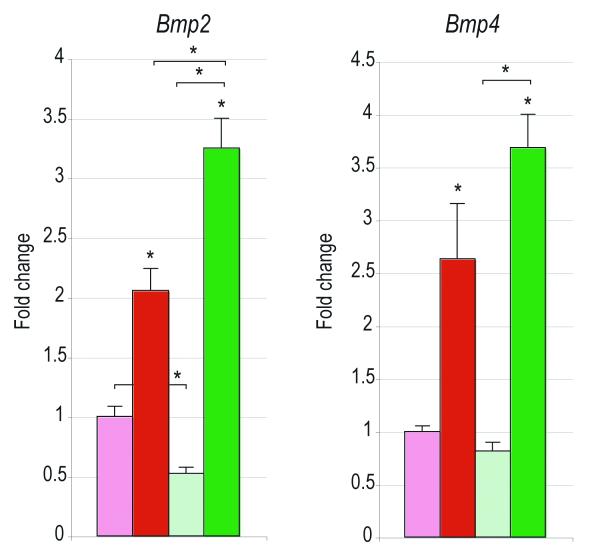
Figure 3. ASCs enhance the osteogenic differentiation of SMCs.
SMCs were cultured either alone (light red and green bars) or in co-culture with ASCs (dark red and green bars); osteogenic differentiation was performed. (A) Alkaline phosphatase (ALP) staining at 3d differentiation. Alizarin red (AR) staining and quantification at 7d differentiation. (ANOVA F=194.92, *p=0.0001; for post-hoc comparison of PF compared to PF:ASC, *p=0.0002; for post-hoc comparison of SAG alone compared to SAG:ASC, *p=0.0001) (B) From left to right, Runx2, Alp, Col1a1 expression at 7d differentiation as assessed by qRT-PCR. (ANOVA F=376.52, 35.53, 111.59, respectively, *p=0.0001 for all genes) (C) From left to right, Bmp2, Bmp4 expression at 7d differentiation as assessed by qRT-PCR. (F=l69.46, 60.06, *p=0.0001, 0.0001 for Bmp2 and Bmp4, respectively). N=5 distinct hASC populations from 5 patients, which yielded 5 distinct data sets that were pooled for analyses. Statistics were calculated by two-factor ANOVA followed by a post-hoc Student’s t-test with Bonferroni correction. For ANOVA *p<0.05 was considered significant, for post-hoc test *p<0.0083 was considered significant.


