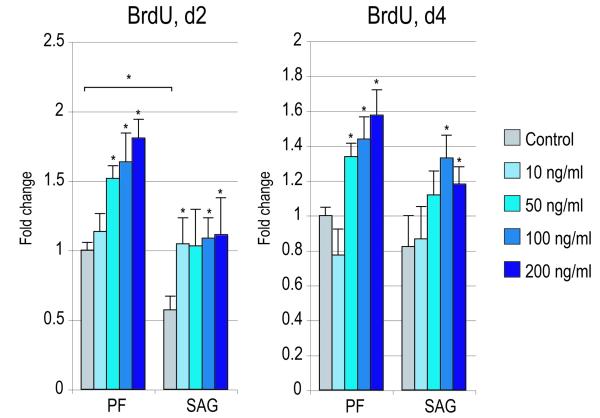
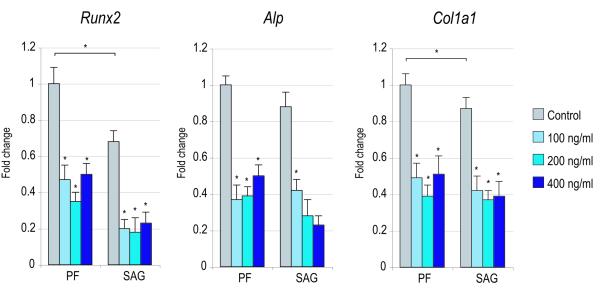
Figure 4. Effects of recombinant Noggin in SMCs.
SMCs were isolated from PF and SAG sutures and exposed to recombinant Noggin. (A) Cellular proliferation after 2 and 4d with or without rNoggin by BrdU incorporation (N=6) (for 2d BrdU ANOVA: F=41.43, 7.54, *p=0.0001, 0.0001 for PF and SAG SMCs respectively; for 4d BrdU ANOVA: F=51.75, 13.23, *p=0.0001, 0.0001, respectively). (B) Osteogenic gene expression after 3d with or without rNoggin by qRT-PCR (from left to right: Runx2, Alp, Col1a1). (ANOVA among PF SMCs: F=47.24, 69.89, 38.01, respectively, *p=0.0001 for all genes; ANOVA among SAG SMCs: F=42.65, 48.49, 33.34, respectively, *p=0.0001 for all genes) (C) Gene expression of members of the Hedgehog signaling pathway after 3d with or without rNoggin by qRT-PCR (from left to right: the Hedgehog ligand Indian Hedgehog (Ihh), the transmembrane receptor Patched1 (Ptch1), the zinc finger transcription factor Gli1, another member of the Gli family, Gli3 which functions to antagonize Hedgehog, and Rab23 a GTPase and Hedgehog antagonist). (ANOVA for PF SMCs, F=12.60, 4.67, 28.88, *p=0.002, 0.036, 0.0001, for Ihh, Ptc1, Gli1, respectively; ANOVA for SAG SMCs, F=12.05, 9.94, 11.39, *p=0.002, 0.004, 0.0001, respectively). Error bars represent one standard deviation; N=3 distinct SMC populations which yielded 3 distinct data sets that were pooled for analyses. Statistics were calculated by two-factor ANOVA followed by a post-hoc Welch’s t-test. For ANOVA *p<0.05 was considered significant, for post-hoc analysis *p<0.002 for 4A and *p<0.0031 for 4B,C.


