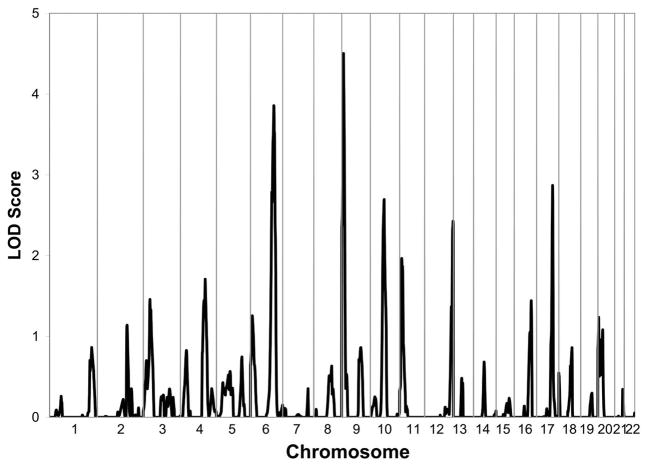
Figure 1.
Multipoint Linkage Analysis for the SRE FIRST FIVE phenotype for the entire genome. Results for each chromosome are aligned end to end with the p terminus on the left. Log of the Odds (LOD) score is plotted on the Y-axis. Vertical lines indicate the boundaries between the chromosomes. The numbers above on the X-axis indicate the chromosome number.

