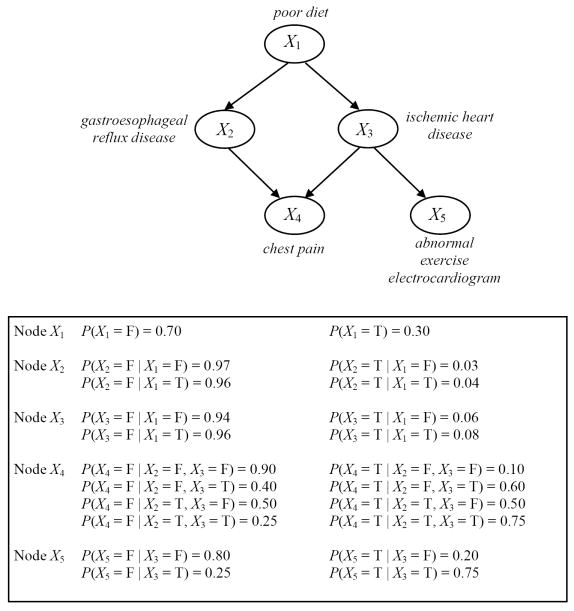
Figure 1.
A simple hypothetical BN for a medical domain. All the nodes represent binary variables, taking values in the domain {T, F} where T stands for True and F for False. The graph at the top represents the BN structure. Associated with each variable (node) is a conditional probability table representing the probability of each variable’s value conditioned on its parent set. (Note that these probabilities are for illustration only; they are not intended to reflect the frequency of events in any actual patient population.)

