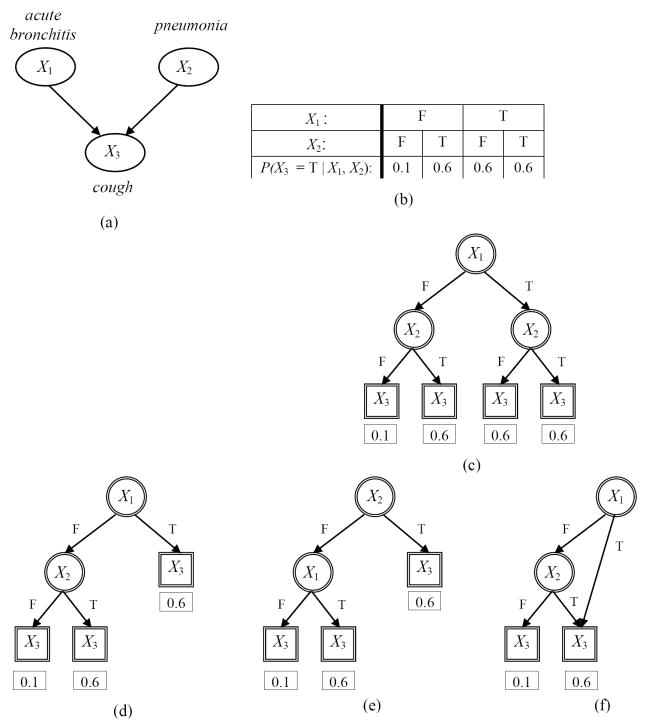
Figure 3.
Examples of CPD representations for a small hypothetical BN where all nodes represent binary variables taking values in the domain {T, F} where T stands for True and F for False. Several CPD representations for the BN node X3 (cough) in panel (a) are shown in subsequent panels. Panel (b) shows a CPT in a standard BN for the node X3 with four parameters (only the values for P(X3 = T ∣ X1, X2) are shown). The CPT can be equivalently represented by a complete decision tree as shown in panel (c). Panels (d) and (e) show alternate decision trees where each one captures one of the two context specific independence relations that is present but not both (see text for details). Panel (f) shows a decision graph that captures both the context specific independence relations (see text for details). Nodes of a BN are shown as ellipses with single lines while nodes of decision trees and decision graphs are shown as either circles with double lines (interior nodes) or as rectangles with double lines (leaf nodes). The values for P(X3 = T ∣ X1, X2) are shown under each leaf node.

