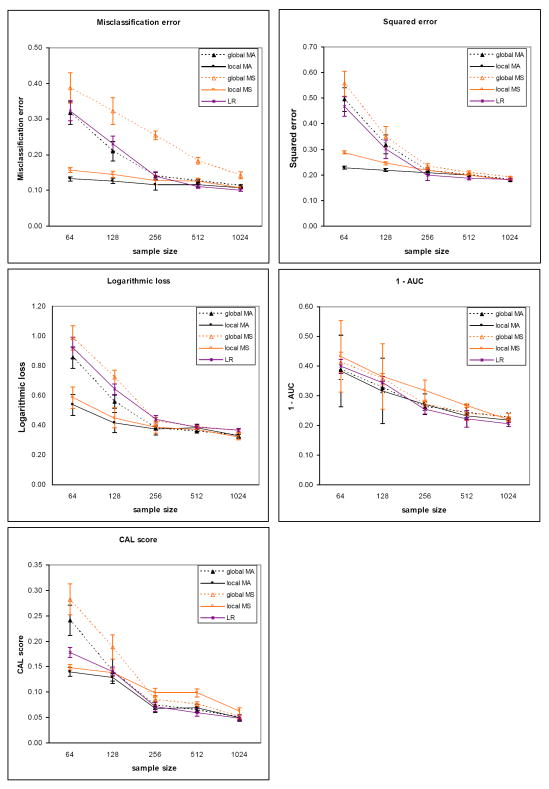
Figure 5.
Sepsis dataset results for the outcome death. Plots show the mean classification error, mean squared error, mean logarithmic loss, mean 1-AUC and mean CAL score of the patient-specific model averaging algorithms vs. model selection versions of these algorithms. For all performance measures lower is better. The sizes of the training dataset vary from 64 to 1024 patient cases. The plots in the solid lines are for the PSMBl-MA (local MA) and the PSMBl-MS (local MS) algorithms; plots in the broken lines are for the PSMBg-MA (global MA) and the PSMBg-MA (global MS) algorithms; and plots in the dotted lines are for logistic regression (LR). The error bars represent one standard deviation.

