Figure 4.

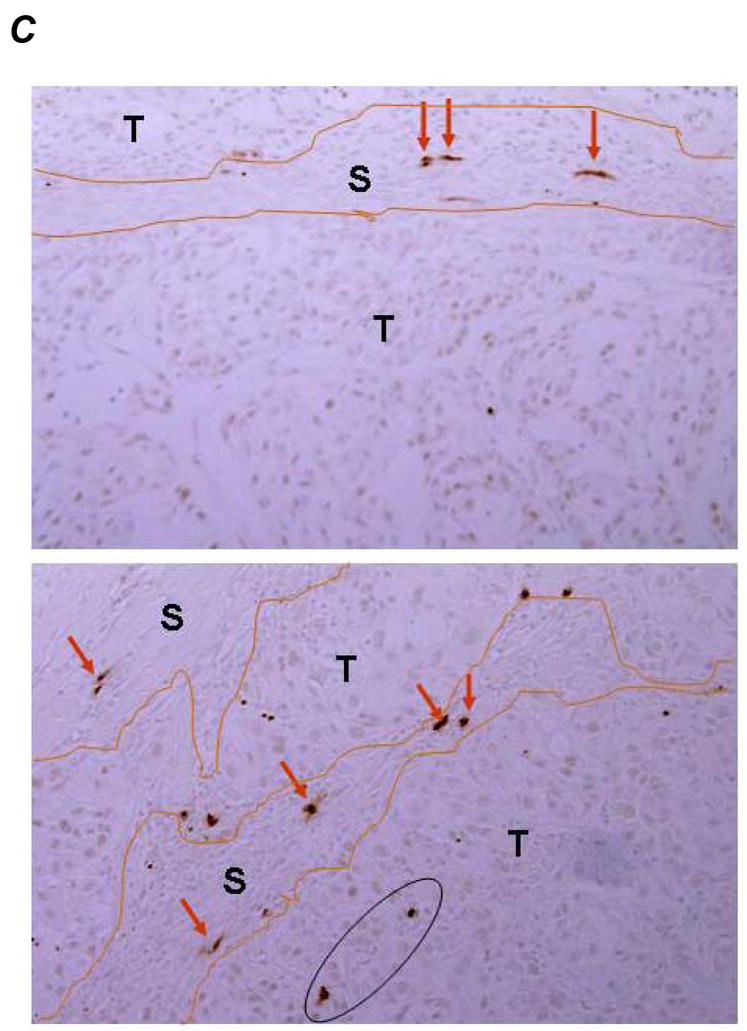
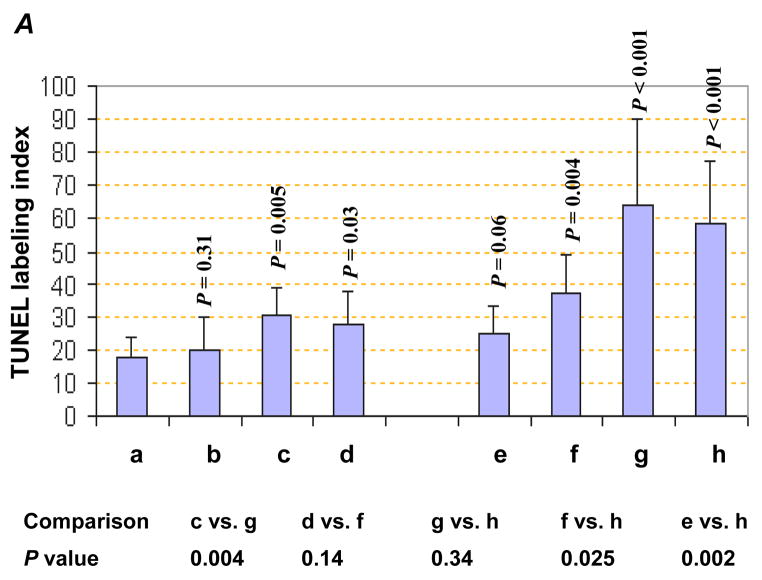
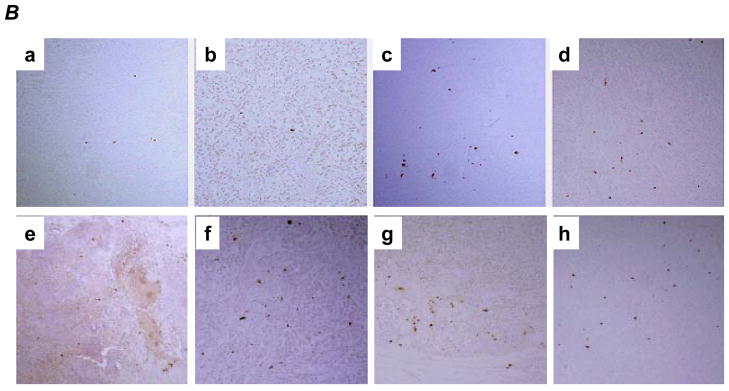
TUNEL assay. A, TUNEL indices. P values are based on comparisons to M31 control group (upper panel) and comparisons listed in the table (lower panel). The error bars represent standard deviations. B, examples: a, M31 antibody treatment; b, bevacizumab treatment; c, H3 antibody treatment; d, Gemcitabine treatment; e, bevacizumab combined with Gemcitabine; f, H3 antibody combined with Gemcitabine; g, H3 antibody combined with bevacizumab; h, H3 antibody combined with bevacizumab and Gemcitabine. C, examples of apoptotic cells in tumor stroma were indicated by red arrows whereas the apoptotic tumor cells were inside a black cycle.


