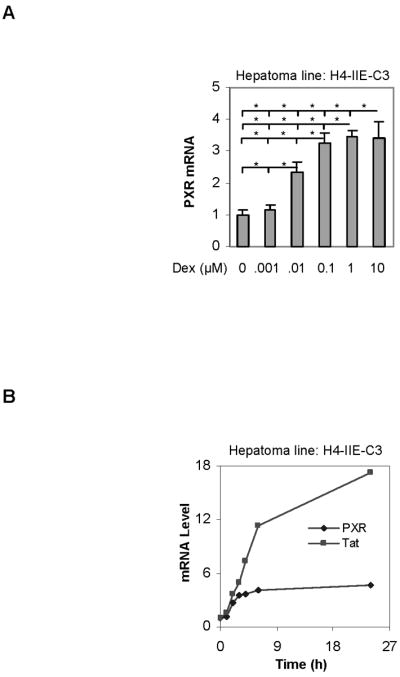
Fig. 2. Induction of rat PXR in H4-II-E-C3 cells by dexamethasone (A) Concentration-response study.

H4-II-E-C3 cells were treated for 24 h with dexamethasone at various concentrations (0–10 μM), and total RNA was analyzed for the level of PXR mRNA by RT-PCR. Similarly the mRNA level was normalized based on the level of Pol II mRNA. Data were shown from three independent experiments. *Statistically significant difference from the vehicle control (p < 0.05). *Statistically significant difference (p < 0.05). (B) Time-course study H4-II-E-C3 cells were treated with dexamethasone at 50 nM and the cells were collected at 1, 2, 3, 4, 6 and 24 h. Similarly, total RNA was analyzed by qRT-PCR for the level of PXR or Tat mRNA by qRT-PCR, and the mRNA level was normalized based on the level of Pol II mRNA. The Ct value of PXR in DMSO control in all time-points is around 26.65.
