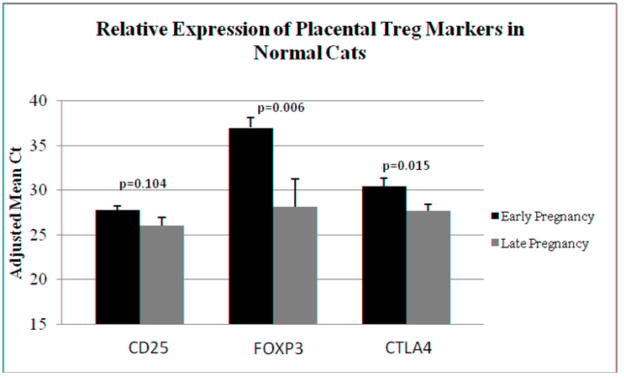
Figure 2.
TaqMan real time RT-PCR analysis of endometrial expression of Treg markers CD25, FOXP3, and CTLA4 in early gestation control (n=18) versus late gestation control (n=13) samples. Bars (adjusted mean Ct) represent mean Ct values subtracted from a negative endpoint (50), and error bars represent standard errors of the mean. P values < 0.05 were considered significant.

