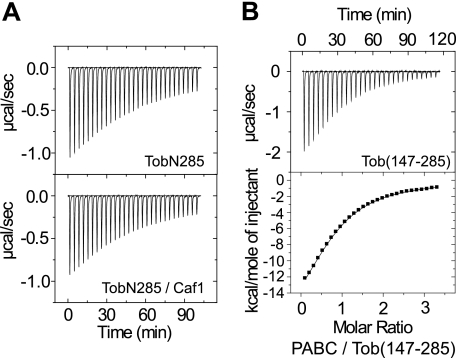
FIGURE 3.
ITC analyses of Tob-PABC interaction. A, trace of the calorimetric titrations of 29 × 10-μl aliquots of 408 μm PABC into the cell containing 39 μm TobN285 (upper panel) and the 1:1 mixture of TobN285 and Caf1 (lower panel, 29 μm each). B, upper panel, trace of the calorimetric titrations of 29 × 10-μl aliquots of 550 μm PABC into the cell containing 37 μm Tob(147–285); lower panel, the integrated binding isotherm obtained from the experiments. The buffer used in the ITC experiments is comprised of 10 mm NaH2PO4 and 50 mm NaCl (pH 7.0). The thermodynamic parameters are summarized in Table 2.

