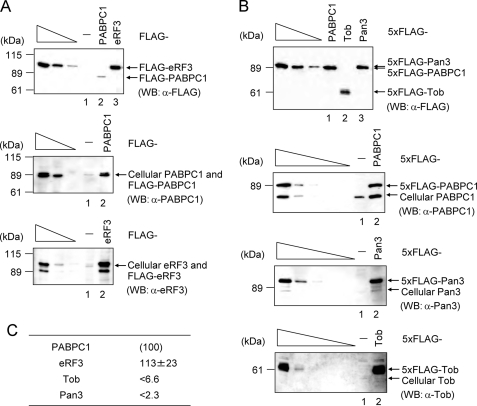
FIGURE 6.
Expression levels of cellular PABPC1, Tob, Pan3, and eRF3 in HeLa cells. A, HeLa cells were transiently transfected with pFLAG-CMV5 (−), pFLAG-PABPC1 (PABPC1), or pFLAG-eRF3 (eRF3). Total cell proteins were analyzed by Western blotting using anti-PABPC or anti-eRF3. The three left-most lanes, which represent the analysis of 4-fold dilutions of total cell proteins, indicate that the analysis is semiquantitative. B, as in A, except that cells were transiently transfected with pCMV-5 × FLAG (−), pCMV-5 × FLAG-PABPC1 (PABPC1), pCMV-5 × FLAG-Pan3 (Pan3), or pCMV-5 × FLAG-Tob (Tob). Total cell proteins were analyzed by Western blotting using anti-FLAG, or anti-PABPC1, anti-Pan3, or anti-Tob. The three or five left-most lanes represent the analysis of 4-fold dilutions of total cell proteins. C, quantification of cellular PABP, Tob, Pan3, and eRF3 in HeLa cells. The levels of Tob, Pan3, and eRF3 were normalized to the level of PABPC1 and were subsequently expressed as a percentage of the level of PABP.

