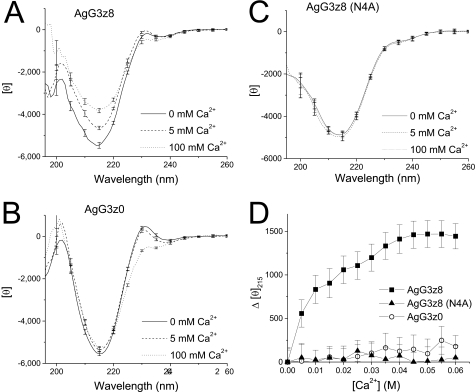
FIGURE 6.
Calcium-induced CD spectrum change in AgG3z8, AgG3z0, and N4A mutant protein. A–C, CD spectra of AgG3z8 (A), AgG3z0 (B), and the N4A mutant (C), measured in TBS with 0, 5, and 100 mm of calcium. D, calcium titration curves of AgG3z8, AgG3z8N4A, and AgG3z0 for the ellipticity shift at 215 nm. The concentration of calcium that causes the half-maximum change in [θ]215 of AgG3z8 is ∼10 mm. In contrast, calcium has little effect on the CD spectrum of N4A mutant and muscle agrin. Each data point represents the mean of four independent measurements, and the S.E. (error bars) are shown at every 10 nm of the wavelength.

