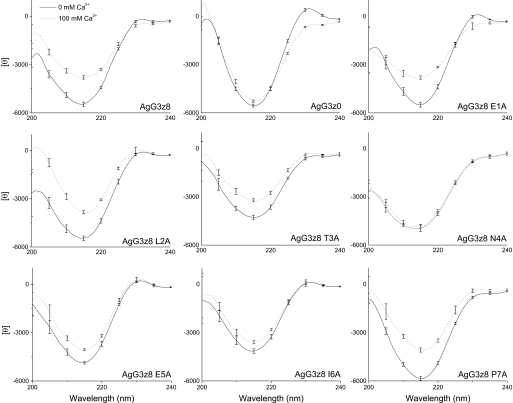
FIGURE 7.
Analysis of AgG3z8 mutant proteins by CD spectrophotometry. The CD spectrum of each protein was measured in TBS with 0 or 100 mm calcium, respectively, and superimposed to show the Ca2+-induced conformational change. The data represent the mean of results from three separate experiments, each with six scans, and the S.E. (error bars) is shown at every 10 nm of the wavelength.

