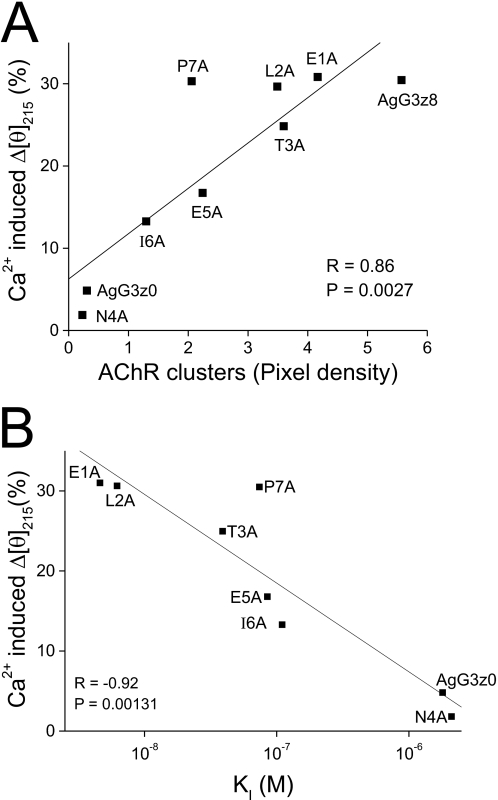
FIGURE 8.
Ca2+-induced protein conformational change is correlated with the AChR clustering activity and the binding affinity of agrin. A, Ca2+-induced reduction in the magnitude of the mean residue ellipticity at 215 nm (Δ[θ]215) of each protein shown in Fig. 5 plotted against the AChR clustering activity of the protein in Fig. 2B. Linear regression analysis indicated a positive correlation (r = 0.86, p = 0.0027). B, linear regression analysis of the correlation between calcium-induced conformational change (Δ[θ]215) and the log KI value of AgG3 proteins shown in Table 1. r = −0.92, p = 0.00131.

