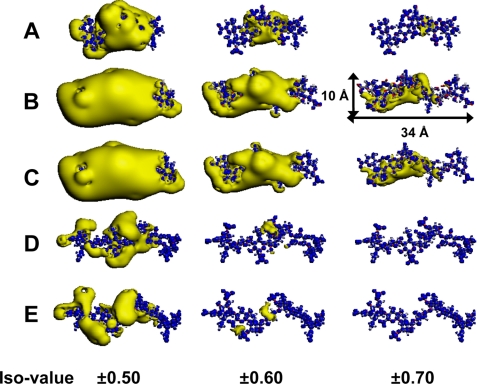
FIGURE 8.
Calculated ESP distribution of the five isolated oligosaccharides. The distribution of ESP was calculated for each isolated oligosaccharide, and electronegative (yellow) and electropositive (blue) zones are shown. A, ΔA-iB-iB; B, ΔE-D-A-D; C, ΔE-D-iA-D; D, ΔC-C-A-C; and E, ΔC-A-A-A. The putative PTN-binding oligosaccharides, ΔE-D-A-D and ΔE-D-iA-D, have spreading electronegative zones at iso values of −0.5 to −0.7 and even ΔA-iB-iB had a small electronegative zone at −0.7. In contrast, the non-binding octasaccharides, ΔC-C-A-C and ΔC-A-A-A, had no electronegative zones at −0.7. The spread of the electronegative zones for the PTN-binding oligosaccharides was larger than that for the non-binding oligosaccharides at the same iso values. The iso values are 0.5, 0.6, and 0.7 eV for the iso surface of the electropositive zones and −0.5, −0.6, and −0.7 eV for that of the electronegative zones.

