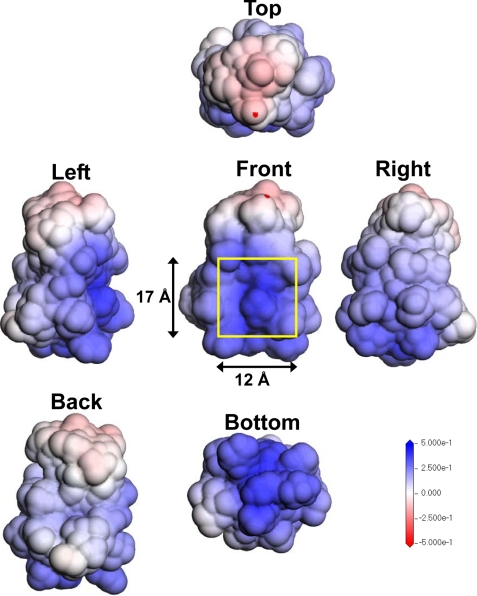
FIGURE 9.
ESP zone mapped to the solvent accessible surface area of PTN. The ESP zones of PTN, which were mapped to the solvent accessible surface area, were determined using ab initio DFT under the same conditions as those for the oligosaccharides except for the basis set. The basis set used for PTN was double numerical because PTN is much larger in size than the oligosaccharides. The solvent accessible surface area is 1.4 Å (the radius of a water molecule) from the van der Waals surface. The six visualized images indicate individual ESP distributions corresponding to the top, bottom, front, back, left, and right sides of the PTN molecule, respectively. The range of the values for contour maps is 0.5 eV (blue) for the electropositive surface and −0.5 eV (red) for the electronegative surface. The yellow square frame and the scales show the size of the cavity of the PTN molecule.

