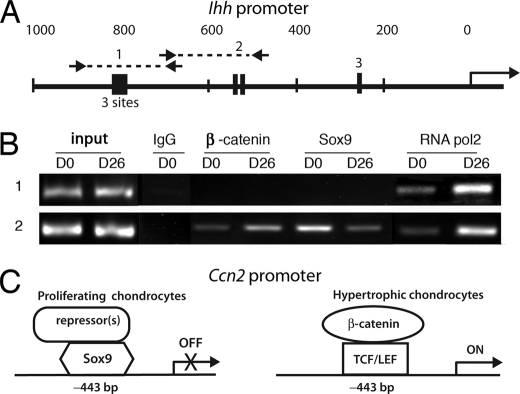
FIGURE 8.
Differential occupancy of the Ihh promoter by β-catenin and Sox9 in osteochondro-progenitor versus hypertrophic chondrocytes. A, shown is a schematic diagram of the mouse Ihh proximal promoter region. Arrows mark the primers used to amplify regions 1 and 2. The primer sequences are indicated under “Experimental Procedures.” TCF·LEF consensus sites are represented as black boxes. Three TCF·LEF consensus sequences separated by 1–5 bp are present in region 1. A, the TCF·LEF site identified previously by Später et al. (45) is shown as region 3. B, ChIP analysis of Ihh promoter occupancy in D0 versus D26 ATDC5 chondrocytes is shown. ChIP for RNApol2 confirms activity of the Ihh promoter is higher in D26 cells than in D0 cells. C, model depicting proposed interactions of Sox9, TCF·LEF, and β-catenin at the −443 bp site in the Ccn2 proximal promoter is shown. In osteochondro-progenitors, a repressive Sox9 complex occupies the −443-bp site. In hypertrophic chondrocytes, stabilized β-catenin levels rise and Sox9 levels decrease, permitting formation of an activating β-catenin·TCF·LEF complex.

