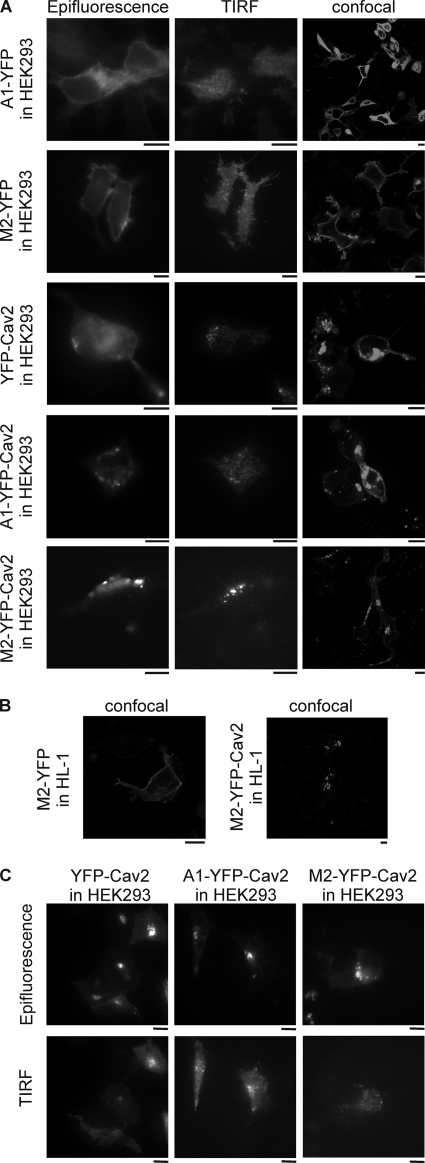
FIGURE 5.
Receptors targeted to caveolae show a punctuate fluorescence pattern. A, epifluorescence, TIRF, and confocal microscopy images of HEK293 cells expressing A1-YFP, M2-YFP, YFP-Cav2, A1-YFP-Cav2, or M2-YFP-Cav2. Bar, 10 μm. B, confocal microscopy images of M2-YFP- and M2-YFP-Cav2-expressing HL-1 cells. Bar, 10 μm. C, epifluorescence and TIRF images of HEK293 cells expressing YFP-Cav2, A1-YFP-Cav2, or M2-YFP-Cav2 after incubation with 2 mm MβCD. Bar, 10 μm. Images were acquired as detailed under “Experimental Procedures.”

