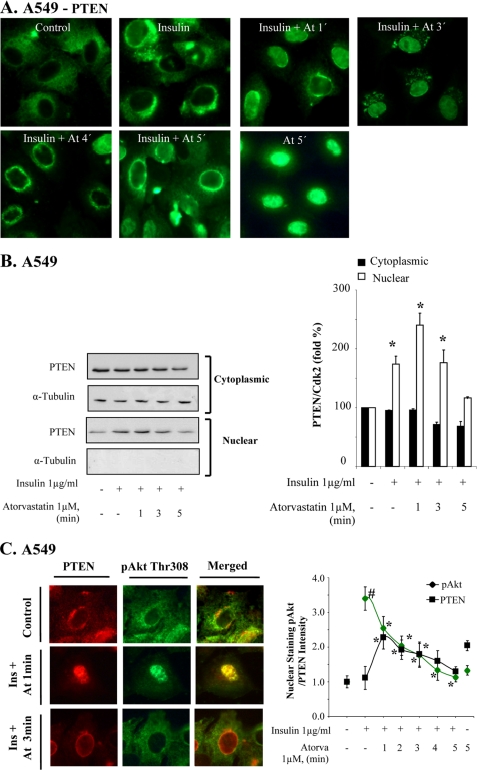
FIGURE 3.
Statin induces rapid nuclear PTEN localization. In A–C, cells were treated with insulin (1 μg/ml for 15 min) and thereafter with atorvastatin (1 μm for 1–5 min) as indicated. In A, cells were stained with a PTEN antibody. In B, samples were analyzed by Western blotting, employing antibodies for PTEN and α-tubulin. The diagram shows means (columns) ± S.D. (bars) from three independent experiments. *, significantly different from control, p ≤ 0.05. In C, cells were stained for PTEN (red) and pAkt Thr308 (green), and the cells from one experiment are shown separately or merged. Note the yellow nuclear corona in merged pictures at 3 min. The diagram shows results from 50 cells expressed as the relative nuclear staining intensity (mean ± S.D. from 20 nuclei). *, significantly different from control; #, significantly different from insulin, p < 0.05.

