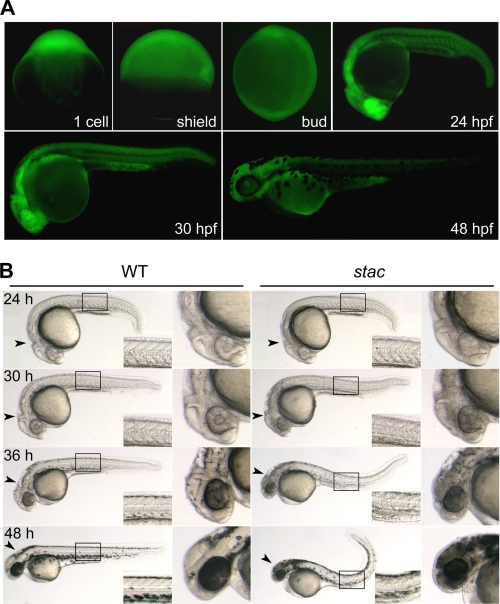
FIGURE 1.
GFP expression pattern and phenotype of stac transgenic embryos. A, fluorescent images of stac embryos showing GFP expression at indicated stages. The genotypes of pictured embryos at early stages were not determined, whereas pictured embryos at 24–48 hpf were heterozygotes. B, morphology of stac mutant and wild type (WT) sibling embryos at indicated stages. The boxed trunk area was enlarged in the corner, and the head was enlarged in the right panel. Note that mutant embryos had a darker head, rough skin, and curly posterior trunk with stage-dependent degrees.

