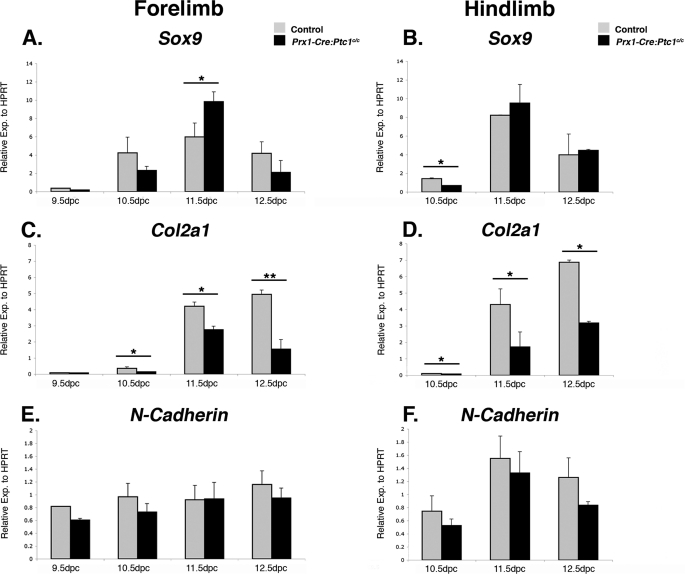
FIGURE 2.
Expression of chondrogenic markers in control versus Prx1-Cre:Ptc1c/c autopods. Quantitative real time RT-PCR revealed up-regulated Sox9 in Prx1-Cre:Ptc1c/c forelimb autopods at 11.5 dpc but no significant difference at other time points in forelimb or hindlimbs (A and B). Col2a1 was significantly down-regulated in Prx1-Cre:Ptc1c/c autopods from 10.5 dpc (C and D). N-Cadherin expression was unaffected in mutant limbs (E and F). Gli1 and Ptc1 data for 12.5 dpc autopods is available under supplemental Fig. S1. *, p < 0.05; **, p < 0.01. Error bars represent the S.D.

