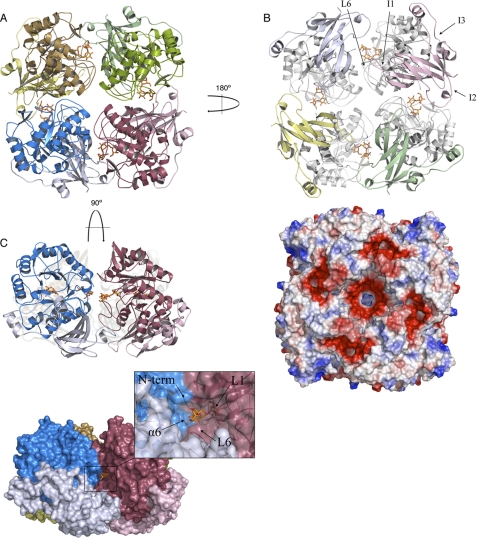
FIGURE 3.
Tetramer of ScAGal. The ScAGal tetramer is shown in schematic representation from three different views (A–C). A raffinose bound to the active site is represented as sticks. Important loops involved in oligomerization and substrate specificity are labeled in B. The electrostatic distribution in the tetramer surface calculated with PyMOL (22) (B) reveals the five acidic patches (red) that are generated upon oligomerization. The surface representation of the tetramer shows the active site cleft in C. The frame highlights the catalytic pocket with loops involved in substrate recognition.

