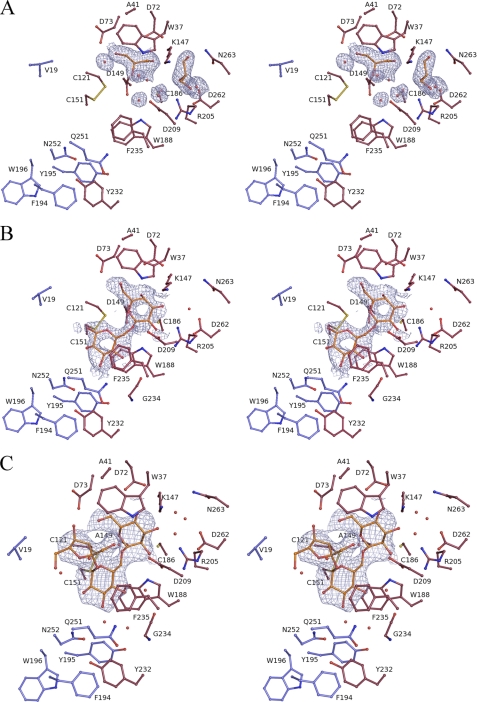
FIGURE 4.
ScAGal-substrate complexes. Stereo view of the catalytic pocket of the native ScAGal (A), the complex with melibiose (B), and the complex with raffinose (C). Amino acid residues and substrates are shown in stick representation, and relevant water molecules are represented as red spheres. 2Fo − Fc maps contoured at 1σ (0.30, 0.30, and 0.25 eA−3, respectively) are also given for the molecules bound at the active site. Residues from one monomer are shown in red, and the residues from the adjacent molecule that are interacting with the substrate are in blue. Two glycerol molecules and ordered waters in the native structure (A) are found mimicking the position of the galactose at the subsite −1.

