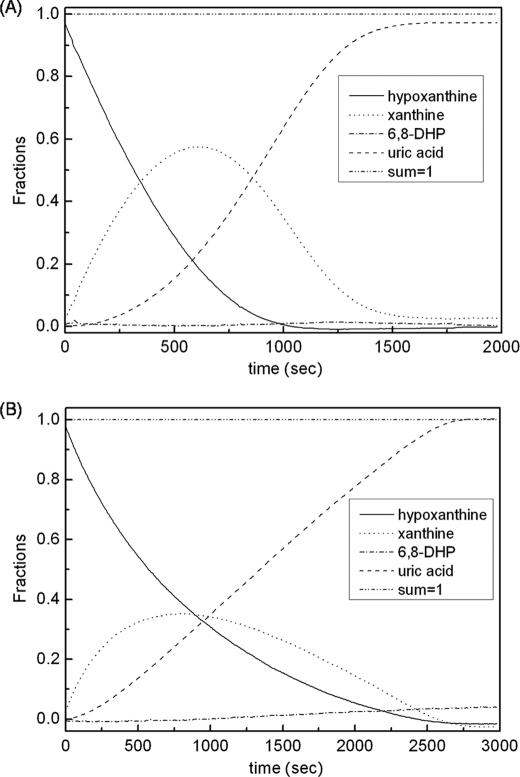
FIGURE 7.
Time courses for hypoxanthine, xanthine, uric acid, and 6,8-dihydroxypurine obtained from spectral deconvolution of the spectra observed in the course of enzyme action on a 50 μm solution of hypoxanthine. A, the time course as seen in 0.1 m pyrophosphate, 0.3 mm EDTA, pH 8.5. B, the time course as seen at 0.1 m phosphate, 0.3 mm EDTA, pH 7.0. The functional enzyme concentration was 6.7 nm at pH 8.5 and 6.8 nm at pH 7.0. The reaction conditions were 250 μm O2 at 25 °C.

